Work Cycle Data
You can find the following information in the <Cycle Data> tab:
(j) | Pressure curve of the selected work cycle |
(k) | Calendar for selecting a work cycle |
(l) | Under <Counter>, you can find the numbering of the work cycles available for selection for the marked date. |
(m) | Under <Tool Cycle Data>, you can find the following information on the selected work cycle:
|
(n) | Button for creating a report on several work cycles |
(o) | Button for creating a report on the displayed work cycle |
In the calendar, select the date of the work cycle whose information you would like to see. Days on which at least one work cycle has been saved are highlighted in orange. The selected date is highlighted in blue.
As soon as a date has been selected, the consecutive numbers of the work cycles performed on that day appear under <Counter>. The selected work cycle, whose pressure curve (j) and work curve data (m) are displayed, is highlighted in blue.
You can save all displayed information on the selected work cycle, including the pressure curve, as a PDF file.
Select <Single Report> (o) for the data of the currently displayed work cycle.
If you select <Multi-Cycle Report> (n), another menu opens:
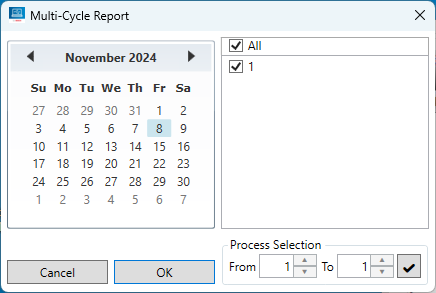
In the calendar, select the date for which you would like to create the report. The selected date is highlighted in blue. Then mark the numbers of all the work cycles for which you would like to create the report. Confirm the selection with <OK> to save the multi-report.
You can also access the <Multi-Cycle Report> menu by selecting the <Report> submenu under <File>.